HOTSPOT
You have the datasets shown in the following graphic.
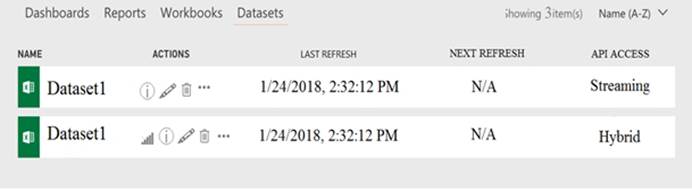

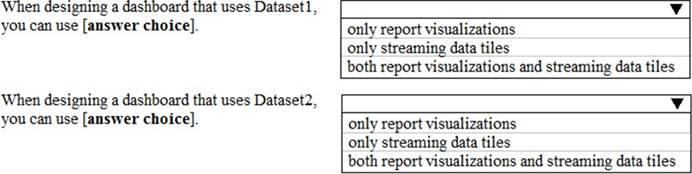
Use the drop-down menus to select the answer choice that completes each statement based on the information presented in the graphic.
Note: Each selection is worth one point.

Answer: 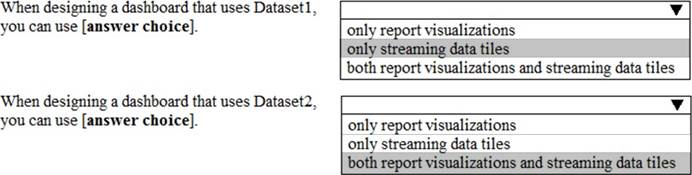

Explanation:
References:
https://docs.microsoft.com/en-us/power-bi/service-real-time-streaming
http://radacad.com/integrate-power-bi-into-your-application-part-6-real-time-streaming-and-push-data