Posted by: Pdfprep
Post Date: October 4, 2021
HOTSPOT
You are creating a column chart visualization.
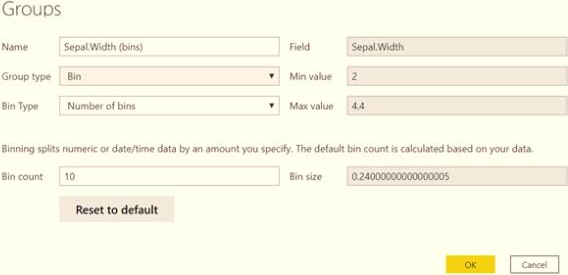
You configure groups as shown in the Groups exhibit. {Click the Groups tab.)

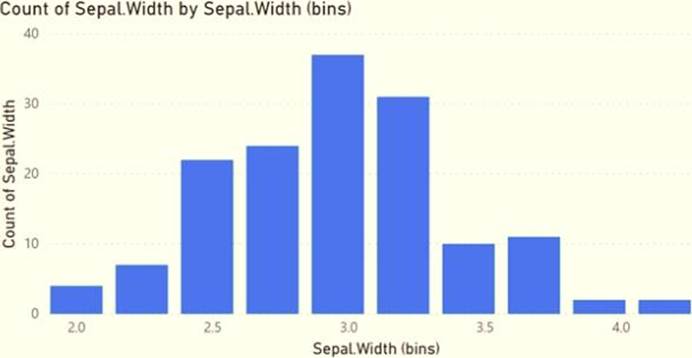
The visualization appears as shown in the Chart exhibit. (Click the Chart tab.)

For each of the following statements, select Yes if the statement is true. Otherwise, select No. NOTE: Each correct selection is worth one point.

Answer: 
