Posted by: Pdfprep
Post Date: October 29, 2020
The chart below is an example of a:
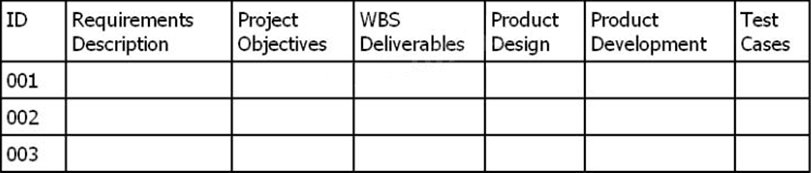
A . Responsibility assignment matrix (RAM)
B . Work breakdown structure (WBS)
C . RACI chart
D . Requirements traceability matrix
Answer: D